A picture is worth a thousand HOURS: how to understand your dataset and model with ggplot2
Wednesday, November 6 2024 01:00PM-04:00PM
Hybrid at McGill
Language of the workshop: EN & FR
What do you do when you first obtain a dataset? How do you understand what a statistical model says about your hypotheses? In both cases, a very powerful technique is to make many figures – probably many more than you would show to your collaborators, committee, or coauthors.
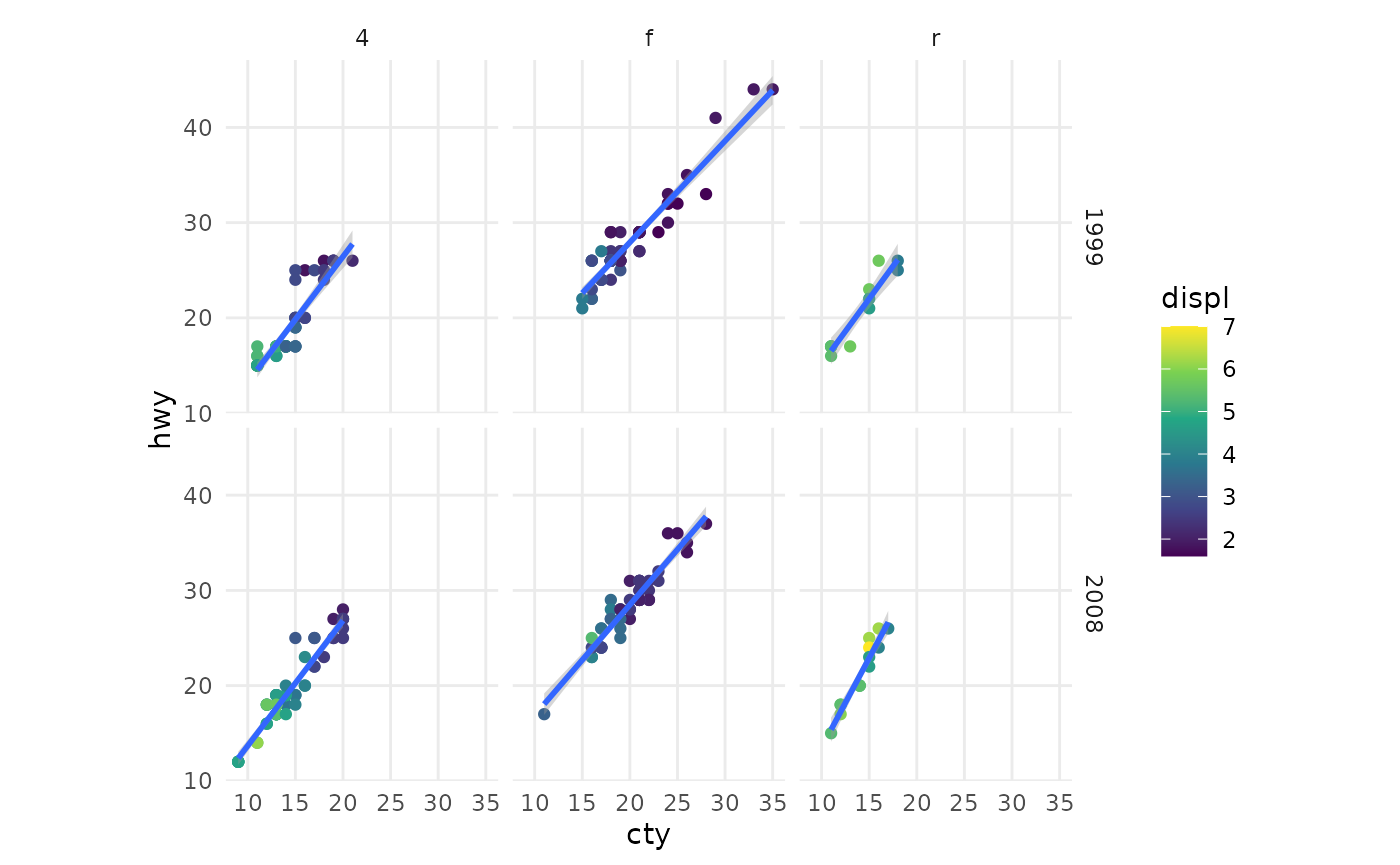
In this workshop we’ll use the R packages ggplot2, emmeans, and marginaleffects to visualize data and models. Visualizing data will help you understand a dataset before you start your modelling work, and visualizing a model will help you validate it, understand it and interpret it for your audience.
Prior knowledge in R programming and some statistical modelling will be helpful for this workshop.
REGISTRATION